HomeStock SectorsEnergy StocksNatural Gas: Hotter July...

Natural Gas: Hotter July Forecasts May Test Storage and Supply Balance

The market continues to navigate a complex mix of seasonal demand patterns, weather volatility, and fluctuating supply and demand. To better understand where the natural gas market might be heading this summer, let’s take a look at the latest trends in prices, storage, and weather forecasts.

Current Prices Vs. Price Spread 10 Days Before Expiry Since 2010

The 2025 summer contracts are trading still above the median expiration price, but remain within the interquartile range. Winter 2026 contracts declined relative to the previous week but remain higher than 2025, similar dynamics can be seen in 2027. The market is slowly but still starting to stabilize.

*The graphs were constructed and based on an analysis of data from Bloomberg and EIA.

Forward Curve vs. 2020-2024

Natural Gas Prices

A strong upward skew on the curve persists through 2025 despite last week’s price decline. The shape of the curve after 2027 is still more stable, and the decline in outright contract prices has not changed it. It is still in a price range close to the corresponding 2023-2024 curves for the same period of the year.

Current Inventory and Forecast for Next Week Compared to 2019-2024

Natural Gas Inventory

For week 26 (June 21-27) we expect a 45 BCF increase in storage. The filling level will be above the median for the previous 5 years. In spite of falling pumping rates, if the current supply and demand situation persists, the peak level of 2024 is possible. The weather in the second half of summer remains a constraint.

Weekly HDD+CDD Total from Current NOAA Data and Forecast for the Next 2 Weeks, Comparing 1994-2024

Natural Gas

Explanation of the chart: in candlesticks quantiles for 30 years from 1994 to 2024. Red dots 2024, green 2025, blue prediction 2025

Conclusions: HDD+CDD values in the first half of June were below the median. Week 27 (June 30-July06) is expected to be still hot relative to the last 30 years. Forecast values for week 28 are on the upper quantile.

Weekly HDD+CDD total from current NOAA data and forecast for the next two weeks compared to 1994-2024 by regions


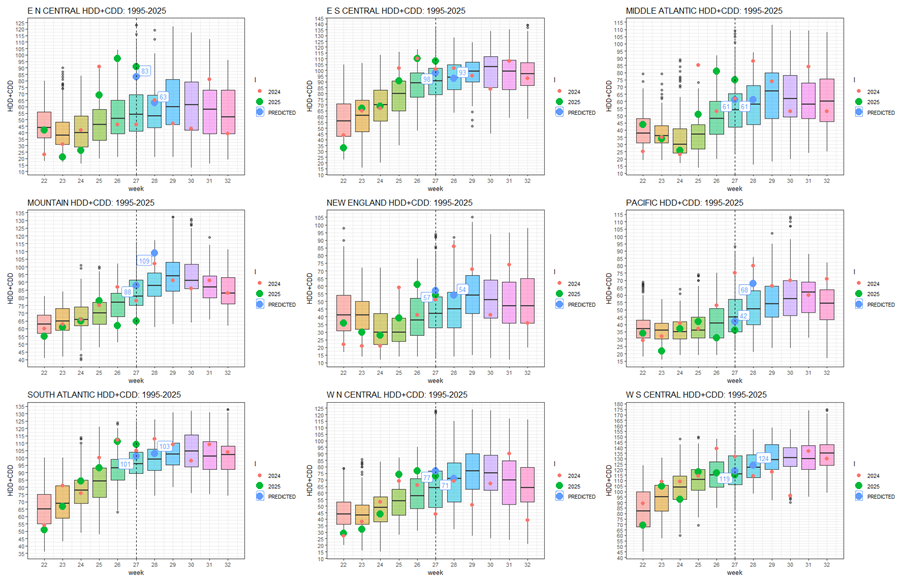
If we take a look at regions, we see forecast values for the current and next week above average in almost all regions.

Change in Monthly Weather Averages for 10 years from 1990 to 2024

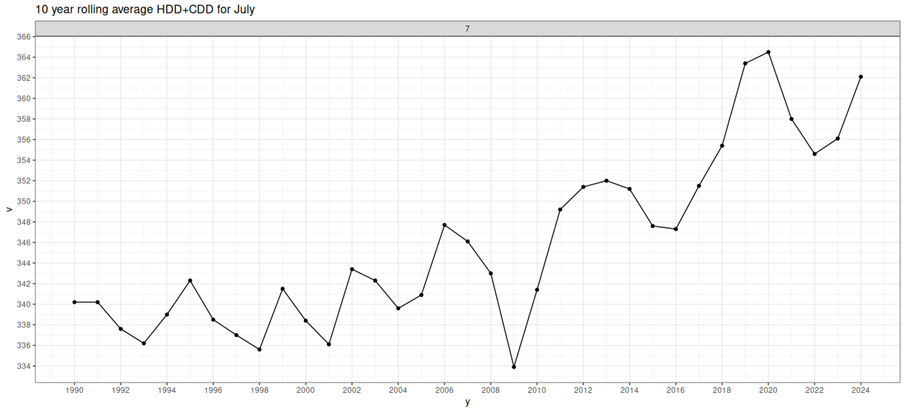
July has gotten 20 HDD+CDD units hotter over the past 30 years

Weekly Cumulative Supply/Demand Difference Compared to 2014-2024

Natural Gas Supply

The April-June 2025 supply/demand balance data is well below the 10-year median due to low temperatures in the first half of summer. The last two weeks have seen a trend reversal towards a higher balance above the historical median. At the same time, due to production growth over the last week, we are watching whether the increased demand from consumption will be compensated by production growth or not.

Percentage change in Spot and nearby futures price relative to the beginning of the year for 2010-2025 by month
Natural Gas Prices

Natural Gas Prices

Based on 15 years of statistics, spot and near-term futures are trading with minimal divergence in July.

Most Popular

More from Author

June Payrolls Jump, but Other Growth Indicators Paint a Sluggish Picture

June beats consensus on the back of education and health...

Fed Gets Breathing Room as Labor Market Holds Firm

The monthly jobs report hit today (unusually, on a Thursday, due...

How California’s Housing Reforms Could Reshape US Cities Over the Next Decade

Things are moving fast these days. Texans for Reasonable Solutions, among others,...

Week Ahead – RBA, RBNZ Decisions and Fed Minutes Eyed as Trade Deals Awaited

July 9 tariff deadline looms as trade deals remain elusive Fed minutes...

Read Now

June Payrolls Jump, but Other Growth Indicators Paint a Sluggish Picture

June beats consensus on the back of education and health services employment, while private NFP surprises downside. With S&P Global monthly flat over the last six months through May, many key indicators followed by the NBER  Business Cycle Dating Committee (BCDC) are flat or falling...

Fed Gets Breathing Room as Labor Market Holds Firm

The monthly jobs report hit today (unusually, on a Thursday, due to the real and perfectly sensible holiday tomorrow blocking the typical Friday release) and the reaction was immediate. All the equity futures remain strong, but paradoxically, it can sometimes be a spike to the upside that...

How California’s Housing Reforms Could Reshape US Cities Over the Next Decade

Things are moving fast these days. Texans for Reasonable Solutions, among others, has helped push through a number of housing reforms in Texas. Maine has passed a couple of bills that should allow more step-change urban development, as I put it in the “Market Segmentation” post. And California has suddenly...

Week Ahead – RBA, RBNZ Decisions and Fed Minutes Eyed as Trade Deals Awaited

July 9 tariff deadline looms as trade deals remain elusive Fed minutes to be watched after positive jobs report RBA expected to cut but RBNZ to likely stay on hold OPEC+ to probably raise output again UK GDP, Canadian employment and Chinese CPI data also on tap The Race to the Finish...

The Fiscal Treadmill Is Speeding Up and Washington Keeps Jogging

As of 1980, the rolling 10-year and 20-year real GDP growth rates stood at 3.2% per annum and 3.5% per annum, respectively. Owing to a slight boost from the good parts of Reaganomics—sweeping deregulation, tax rate cuts, and sound money, which were partially offset by the long-term ills...

Immuthera’s Scientific Advisory Board: World-Leading Expertise Driving Next-Generation Diabetes and Immunotherapy Solutions

Immuthera's Scientific Advisory Board: World-Leading Expertise Driving Next-Generation Diabetes and Immunotherapy SolutionsDistinguished experts Dr. Jay Skyler, Dr. Desmond Schatz, and Dr. Lawrence Steinman have joined Immuthera's Scientific Advisory Board.Immuthera will continue expanding its Scientific Advisory Board over the coming months to build a truly world-class team.In collaboration...

Risk Assets Extend Gains but Low Volumes Could Skew Monday Open

Yesterday’s market action was driven by consecutive upside surprises in US (147K vs 110K exp) and data (50.8 vs 50.5 exp), fueling another wave of positive sentiment and pushing US equities into yet another frenzied rally. The reaction to the data was progressive but consistent, taking...

Risk-On Sentiment Fades as Tariffs Return to the Spotlight

Dollar surrenders gains posted after robust labour market report Trump celebrates US budget bill approval; scheduled to sign it today Most Fed members feel more comfortable as July rate cut is priced out Oil steadies near $66, gold rally retains momentum Thursday Proved to Be Rather EventfulWhile the US is celebrating...

Oil Prices Set to End the Week With a Modest Gain

prices were on course for a modest weekly gain today, buffeted by both headwinds and tailwinds, including OPEC+ policy, U.S. job numbers, and anticipation of President Trump’s next move on tariffs. At the time of writing, was trading at $68.58 per barrel, with West Texas Intermediate...

Cognition Therapeutics Shares Jump 12% After Hours Following Encouraging Phase 2 Alzheimer’s Trial Data – Cognition Therapeutics (NASDAQ:CGTX), InMed Pharmaceuticals (NASDAQ:INM)

Cognition Therapeutics Inc CGTX rose 12.10% to $0.45 during after hours on Thursday, following a surge of 20.82% gain during regular hours. What Happened: The hike in Cognition Therapeutics’ stock price is attributed to the promising results from its Alzheimer’s drug, Zervimesine. The drug achieved a 95% efficacy...

Oil: How Traders Capitalized on Extreme Price Swings

The first half of the year saw significant oil price volatility influenced by U.S. trade policies, OPEC+ production decisions, and geopolitical tensions. Oil prices initially slumped due to new U.S. tariffs and increased OPEC+ output, leading traders to amass short positions. Prices later spiked in June due to Middle...

Gold Prices Slide as Strong NFP Data Undermines Fed Rate Cut Hopes

Strong NFP Data Put Downward Pressure on Gold Yesterday’s US (NFP) data showed that the labour market remains resilient, putting downward pressure on Gold (). In June, companies created more jobs than expected, and the unexpectedly dropped towards 4.1%. The overall report was better than expected, reducing...